Time-series visualization in python
Oct 29, 2020· ·
1 min read
Georg Heiler
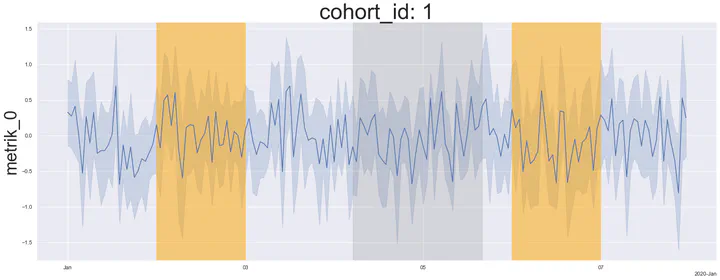
 Time-series with annotated labels for certain intervals.
summary
I hope this is also useful for you when visualizing data in the context of time.
 Time-series with annotated labels for certain intervals.
I hope this is also useful for you when visualizing data in the context of time.